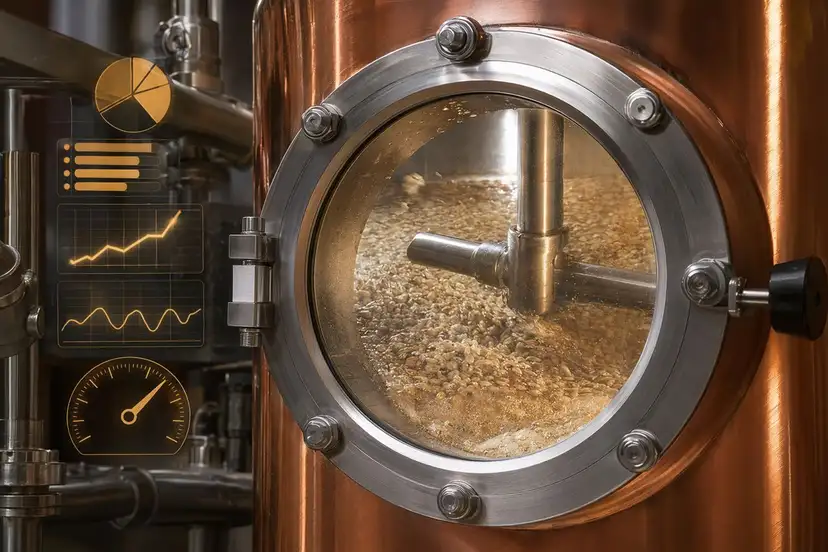
Weekly Distillery Metrics: Grain Bill to Proof Gallons
Track weekly distillery metrics from grain bill, mash viscosity, fermentability, and gravity drop to proof gallons, separations, and enzyme performance.
Request pricing Track weekly distillery metrics from grain bill, mash viscosity, fermentability, and gravity drop to proof gallons, separations, and enzyme performance.
Request pricingIn a beverage alcohol distillery, weekly performance is not defined by one lab number or one good run. It is defined by the relationship between raw material, mash handling, fermentability, fermentation completion, still throughput, and proof gallons collected at spec.
That is where the right scorecard matters. When production managers can connect grain bill decisions to mash viscosity, gravity drop, residual extract, cut behavior, and proof gallon output, process drift becomes visible before it turns into lost alcohol, slow tanks, fouled heat transfer, or inconsistent separations.
Coppercut Catalytics supports spirit producers as a distilling enzyme supplier for spirit production with enzyme programs built around practical plant outcomes: faster starch conversion, better fermentability, lower mash viscosity, more consistent fermentation, and cleaner movement through cooking, fermentation, and distillation.
Proof gallon yield problems often show up at the still, but many of them begin in the grain receiving, milling, and mash preparation steps.
Track these inputs every week:
A weekly review should answer a simple question: did the grain bill behave like the grain bill you designed for?
Corn, rye, wheat, barley, and mixed cereal bills do not bring the same starch accessibility, fiber load, protein behavior, or viscosity profile. If the recipe shifts but the enzyme strategy stays fixed, the process may still run, but it may run slower, thicker, and less predictably.
Viscosity is one of the most practical early warning metrics in a distillery. High viscosity affects agitation, heat transfer, pump load, tank turnover, solids suspension, and downstream separation.
Track weekly:
A mash that is technically converted but still difficult to move can create hidden production cost. It may slow the whole plant, reduce cooling efficiency, create uneven fermentation starts, and make still feed less consistent.
Enzyme selection matters here. Alpha-amylase supports liquefaction and viscosity reduction during cooking. For high-fiber grain bills, supporting enzymes such as beta-glucanase, xylanase, cellulase, or protease may help reduce structural drag and improve flow behavior. The practical target is not a perfect lab curve. It is a mash that moves predictably through the equipment you actually run.
Conversion should be tracked as a process outcome, not only as a pass-fail check. Weekly review should compare expected extract to actual fermentable potential.
Useful indicators include:
If starting gravity is inconsistent, the fermenter is receiving variable substrate. That can lead to staggered fermentation kinetics, variable alcohol content, and uneven still behavior.
Glucoamylase strategy is central to this stage. The objective is to increase fermentable sugar availability without forcing the plant into longer holds, difficult pH windows, or operational complexity that operators cannot maintain across shifts.
The weekly fermentation dashboard should show more than final alcohol. It should show whether tanks are reaching completion on schedule.
Track:
A fermenter that finishes eventually may still cost the plant money if it finishes late. Slow tanks reduce effective capacity, complicate scheduling, and can increase variability in distillation feed.
Enzymes influence fermentation by controlling substrate availability and mash handling. Better liquefaction, improved starch accessibility, and more complete saccharification can support a steadier yeast environment. For production managers, the key metric is simple: more tanks finishing predictably inside the planned window.
Proof gallons are the commercial translation of upstream performance. Weekly yield review should connect proof gallons back to the grain bill and fermenter data, not treat them as a standalone distillation result.
Track:
The most useful trend is not the best run of the week. It is the spread. A narrow spread means the plant is under control. A wide spread means recipe, milling, cook, enzyme application, fermentation, or separation conditions are shifting more than the process can absorb.
Distillation performance depends heavily on what enters the beer well and still. Variable solids, viscosity, alcohol content, and residual extract all affect heat transfer, foam, entrainment risk, and cut behavior.
Track weekly:
Cleaner, more consistent still feed can support steadier operation. Enzyme programs that improve mash breakdown and fermentability can reduce upstream variability before it reaches the column or pot system.
Cut management is where production discipline meets product specification. Even in automated systems, cut movement can indicate upstream process drift.
Review:
If cut lines are moving more than expected, look upstream. Fermentation completion, nutrient balance, microbial load, residual sugars, and still feed consistency can all influence separation behavior.
Enzymes are not a substitute for distillation control, but they can help reduce the upstream variation that makes cut management harder.
Production managers should treat cleaning and fouling as yield-adjacent metrics. A plant that loses hours to plugged lines, fouled exchangers, thick mash, or difficult stillage handling is losing productive capacity.
Track:
For high-solids mash and cereal-heavy bills, enzyme support can improve flow, reduce viscosity-driven handling issues, and contribute to more predictable run time. The value is not theoretical. It is visible in fewer slow transfers, more consistent heating and cooling, and less operator intervention.
A useful weekly scorecard should fit on one page and be reviewed with production, quality, and maintenance together.
Recommended sections:
You may have an enzyme optimization opportunity if weekly records show any of these patterns:
The best enzyme program is not chosen from a catalog alone. It is matched to grain bill, cook design, pH and temperature conditions, solids target, equipment constraints, and production schedule.
Coppercut Catalytics works with distillery teams that need enzyme solutions tied to plant-floor results. We help evaluate where the process is losing value: liquefaction, viscosity control, saccharification, fermentability, high-fiber grain handling, or run-time consistency.
Our approach is built for production managers who need answers that fit the plant:
The strongest weekly metric is not proof gallons alone. It is the chain from grain bill to proof gallons: raw material behavior, mash viscosity, conversion, fermentability, fermentation completion, still feed consistency, cut stability, and run time.
When those metrics are tracked together, enzyme decisions become clearer. The plant can see where value is being lost and where targeted catalytic support can improve consistency.
Ready to review your mash, fermentation, and proof gallon metrics? Use the on-site request a quote form to share your grain bill, process goals, and current constraints. Coppercut Catalytics will help identify a practical enzyme path for your distillery.
Tell us your application and volume — we reply with pricing and lead time.